Some of your memories are your own and other memories are owned by other people. This story is based on memories stewarded by my dear friends Bill and Denise.
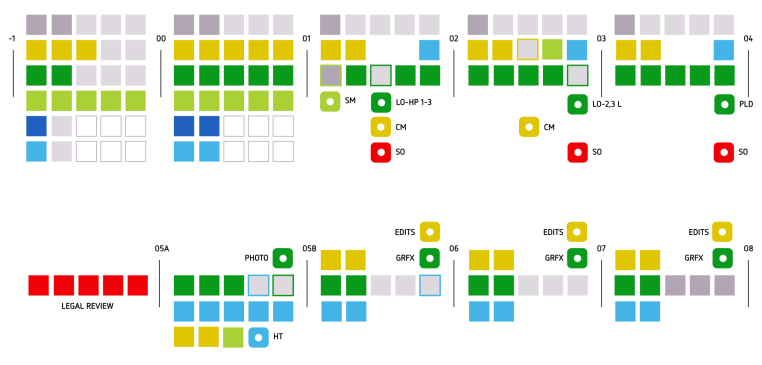
It was Bill’s first year at Fusion Alliance and after a couple of months, he asked me for a quote estimate for a project. This how the image above came to be. I produced the diagram with Adobe Illustrator. The design’s is known as the infamous Chiclet Diagram. At the time it shocked Bill as he was expecting a spreadsheet from me that day. I’m not sure why, but that day was a creative day for me. What’s most interesting to me, is that Bill, now a VP Customer Success at ‘250ok‘, keeps a copy of the diagram in his work environment. I’m not sure why, but I hope it gives Bill and others to create and think differently and feel refreshed by tasks that ordinarily might kill you with boredom.
By now, you’re probably curious about the diagram. Is it gibberish? or is there real data hidden in the clean design? Of course it’s both!
Before I explain the structure, take a minute and scroll up and look at the diagram. You’ll notice there are black numbers with lines that are broken into 5 block chunks. Each block is a work-week of effort. Each color is a role. You should be asking yourself, “why oh why did Jerry not create a legend for poor Bill?” Yes, there was a legend for Bill – Lets review the legend below.
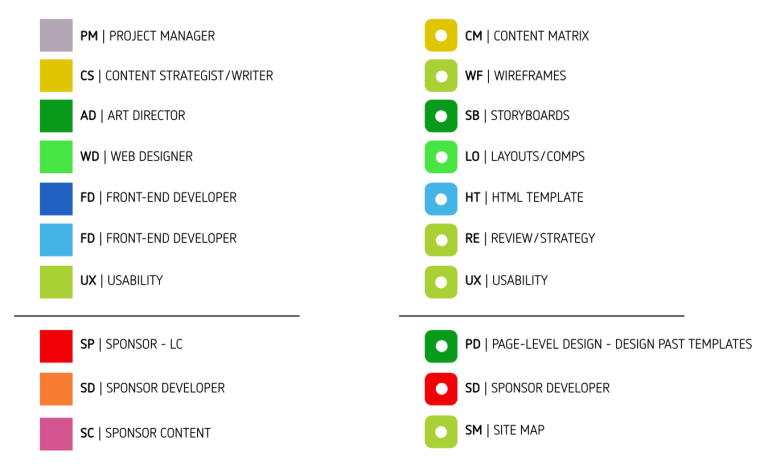
The legend has blocks of color by role ‘for people’. The color continues in them to a rounded square with a white dot in it. This is a deliverable artifact for the project. Now if you look at the Chiclet diagram, you can fully understand it.
I know I said, at the time in the beginning of this article I said, “I don’t know why I produced this diagram”, but as I wrote the text, I began to remember something that will shape the reason around the Chiclet origin.
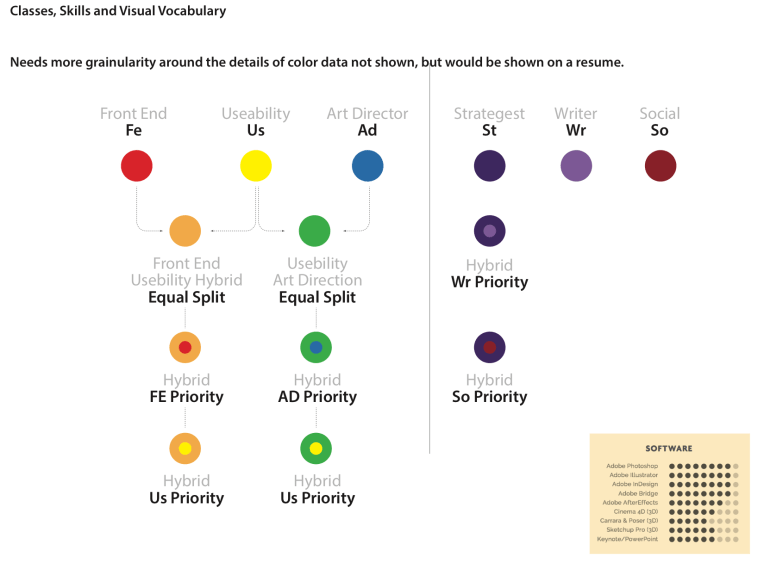
At the time I was on another project – I was being asked to explore a people management application. So, now it should makes sense as I was exploring roles with people as colors and how primary colors would show T-cell skills.
Since this Chiclet diagram was produced, I have not re-used the chiclet method to convey project data. Like most people that ask for numbers and estimates, I do what’s expected and produce a spreadsheet. Did I learn something? or am I like the masses of drone designers that only do what we’re asked to do? I still believe in finding and exploring new ways to new directions. That part of me just has to be poked…but it’s still there.
